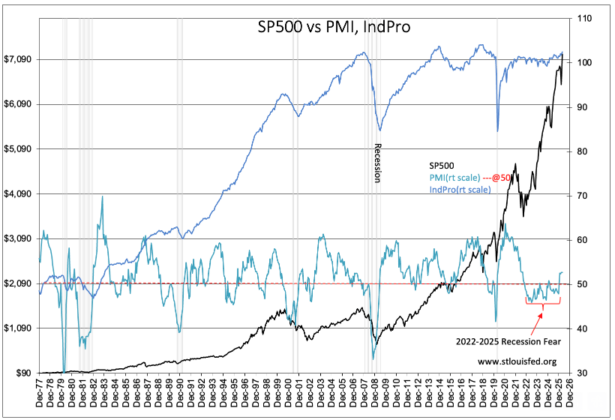
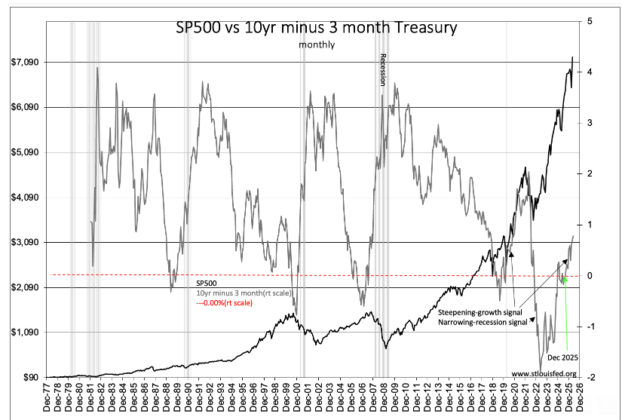
There are four data sets on these two long-term charts but only one is a measure of economic activity. The odd-data set out is IndPro(Industrial Production). The other three are market sentiment driven. That is, they reflect investor perceptions of future returns. There are correlations between the market sentiment measures themselves that are fairly close. They only agree with economic activity over the broad period of an economic cycle. There is an unmistakable correlation between the mfg PMI and the 10yr minus 3 month Treasury(called the Yield Curve). Both peaked late 2021, then the next 12mos declined into negative territory and stayed there for nearly 3yrs till Dec 2025.