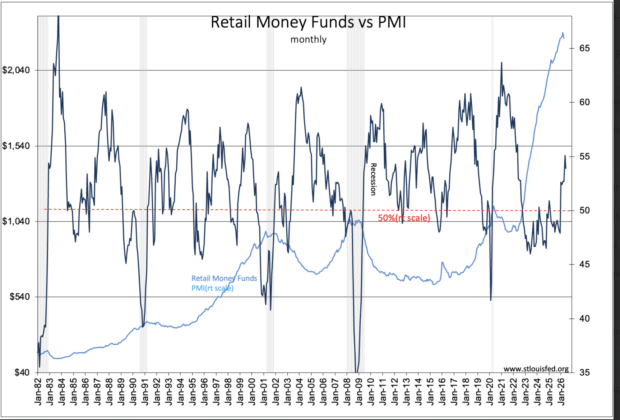
The PMI and Retail Money Funds(RMF) are well correlated market psychology indicators. This chart compares monthly data that is dependent on the pace of monthly manufacturing PMI releases. RMF reports weekly and monthly only available through May while the PMI is through June. Just the same, the data display a distinct top formation that is in sync with prior periods when the PMI turned above 50%. Both are distinctly correlated with media perceptions of economic activity. What has been very different this time, since 2015-2016, has been the perception that high tech issues have been able to power through recession periods. Institutions became convinced of this when high tech emerged as growth vehicles during the COVID-lockdown work-from-home period. High tech became a ‘can’t lose investment choice’. Post-COVID, the PMI spurted to mid-60% range quickly on a general recovery but gave way to sub-50% in mid-2022 and remained there for the most part till Jan 2025. The belief of rapid COVID exit for manufacturing quickly met the realities that rejiggered supply chains could not nearly adjust as quickly as market expectations. What held up was high tech which evolved post-COVID. The COVID work-from-home related issues declined but investors transitioned from gaming to cryptocurrency which then transitioned quickly to AI leaving Nvidia(NVDA) and related as the top performers in the SP500 even as the media posted relentless recession forecasts. A few favorite tech issues has dominated the SP500 since. Today 10 issues represent 39.75% o the SP500. However, the investors are rapidly warming to US industrial, transportation and construction issues as it becomes apparent significant growth is occurring with the new tariff agenda.
It looks like individual investor psychology is turning positive with the PMI as this has historically.