“Davidson” submits:
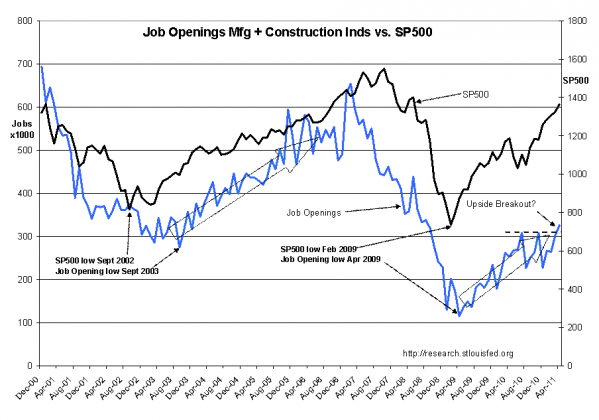
The chart below of the Job Openings Mfg + Construction Inds vs. SP500 ($SPY) comes from data recently added to the St. Louis Fed’s FRED® Economic Data. The St Louis Fed has bolstered this free site with over 30,000 global data series and can provide unique insight into the actual workings of the economy for those willing to take the time to explore its many offerings.
By combining various series one can identify relationships crucial to investors. One of the strongest links to investment markets is that between employment and stock and bond prices. It follows that Job Openings which are the precursor to employment, i.e. Labor Demand reflects higher levels of economic activity and future employment. Improving employment drives improving net income and in turn drives Auto & Lt Truck Sales and New Home Sales which in a virtuous circle results in additional new labor demand till society’s needs are met.
Having experienced ~30yrs of markets and listened to many experts on many topics and learned many lessons, there is one that stands out amongst them all. That lesson turns out to be the simplest and least complicated of them all. That investors tend to over-complicate and focus on the minutia! This stems from what psychologists call “The Recency Effect”, i.e. the belief that the most recently experienced events should be given the greatest weight in our decisions. When investing, I recommend that the reverse actually produces the better perspective.
In the chart below Job Openings Mfg + Construction Inds vs. SP500 reveals that market tops are preceded by a slackening of labor demand by a significant margin. At market bottoms Job Openings are a lagging indicator. If one looks at the historical relationship between Household Survey and the SP500 one will find a similar history going back to 1948. Job Openings data precedes employment trends and thereby provides insight to future investment trends.
The current direction in Job Openings data (not the month-to-month variation which drives rapid trading) is decidedly in an up-trend. One can observe that the current trend since Apr 2009 appears quite similar to the recovery/expansion trend from Sept 2003. The Business Cycle Value Investor is interested in the broad patterns of the business cycle. Not the week-to-week, month-to-month and momentary data wiggles which in themselves are virtually worthless inputs without a trend for comparison.
Manufacturing and construction industries are some of the strongest value creation engines of our economy. It is always positive for stocks when these economic engines are driving labor demand in up-trends.
The current focus on Greece and other temporary issues do not change the dramatic improvements that are occurring in our economy. 9/11 was such a short term event and the evidence in Job Openings Mfg + Construction Inds vs. SP500 chart reveals that like then one should today ignore the details and focus on the trends.
The economic trend is up! The chart even reveals that Jobs Demand for April 2011 may reflect an upside breakout!I recommend that investors take advantage of any periods of negative market psychology to add capital to accounts.
